> For the complete documentation index, see [llms.txt](https://manual.egclinea.com/llms.txt). Markdown versions of documentation pages are available by appending `.md` to page URLs; this page is available as [Markdown](https://manual.egclinea.com/bi/ovrige-funktioner.md).

# Øvrig visning af data

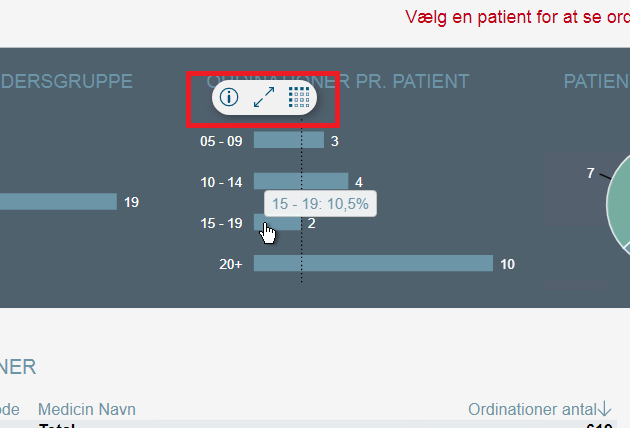
Ved hver filtreringsdel i en dataanalyse (bortset fra filtreringsmenuerne i toppen) vises der en boks med to eller flere ikoner, når du holder musen over feltet.

Eksemplerne nedenfor bruger graferne i topbjælken, men infoboksen fungerer på samme måde andre steder, f.eks. i kriterielisterne i venstre side af skærmen.

<div><img src="https://3548167157-files.gitbook.io/~/files/v0/b/gitbook-x-prod.appspot.com/o/spaces%2FfDHx4SrlSNAKGCJ3m7yH%2Fuploads%2Fgit-blob-fbb5be4431a8f772450d1775c00904ebc0bb8852%2Fhmfile_hash_56192e1c.png?alt=media" alt="Infoboks i topbjælken" width="473"> <figure><img src="https://3548167157-files.gitbook.io/~/files/v0/b/gitbook-x-prod.appspot.com/o/spaces%2FfDHx4SrlSNAKGCJ3m7yH%2Fuploads%2Fgit-blob-c8c69566f196c0e7c17db33434d298cc5f2bd8f3%2Fhmfile_hash_a3e940d7.png?alt=media" alt=""><figcaption><p>Infoboks i kriterielisterne i venstre side af skærmen</p></figcaption></figure></div>

## Visning af datagrundlag

Ønsker man at få vist, hvilket datagrundlag der er benyttet til visning af en graf, et diagram eller en liste, kan der klikkes på **informations-ikonet** i boksen:

![Underliggende data - infoikon](https://3548167157-files.gitbook.io/~/files/v0/b/gitbook-x-prod.appspot.com/o/spaces%2FfDHx4SrlSNAKGCJ3m7yH%2Fuploads%2Fgit-blob-9c0d67df36a621e3ce29e143002dd8ab0ee178d0%2Fhmfile_hash_812992b6.png?alt=media)

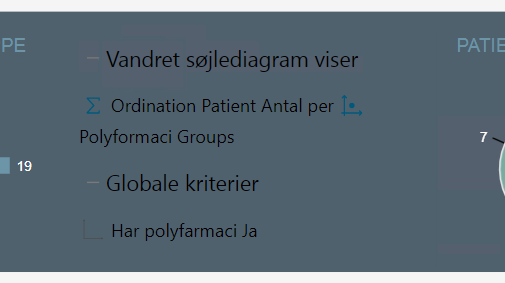
Herefter vil man blive præsenteret for en liste over de kriterier, der er benyttet for at vise netop den tabel, den graf eller det diagram, musemarkøren var placeret hen over.

I nedenstående tilfælde er det kriterierne for grafen '*Ordinationer pr. patient*' i dataanalysen 'Polyfarmaci' der vises

<img src="https://3548167157-files.gitbook.io/~/files/v0/b/gitbook-x-prod.appspot.com/o/spaces%2FfDHx4SrlSNAKGCJ3m7yH%2Fuploads%2Fgit-blob-fdea0e8c1b09f3cc361cd5f5a3e78694b71c9933%2Fhmfile_hash_ba4a6c2e.png?alt=media" alt="Underliggende data - graf" width="379">

For at vende tilbage og få vist grafen igen, holdes musemarkøren påny henover området og i boksen der fremkommer klikkes på knappen '**Vis diagram**':

<img src="https://3548167157-files.gitbook.io/~/files/v0/b/gitbook-x-prod.appspot.com/o/spaces%2FfDHx4SrlSNAKGCJ3m7yH%2Fuploads%2Fgit-blob-72f3466c0e4cd1b2d97410a0682ec53ed5045fb5%2Fhmfile_hash_d89a0b53.png?alt=media" alt="Underliggende data - grafikon" width="310">

## Visning af data i fuld skærm

Data kan også maksimeres til fuld skærmvisning. Dette gøres ved at man, i boksen der popper op, klikker på **ikonet til fuld skærm**:

<img src="https://3548167157-files.gitbook.io/~/files/v0/b/gitbook-x-prod.appspot.com/o/spaces%2FfDHx4SrlSNAKGCJ3m7yH%2Fuploads%2Fgit-blob-14f339e076682113b9e55d0b32155d25654ed8fb%2Fhmfile_hash_5625215d.png?alt=media" alt="Underliggende data - fuldskærmsvisning" width="295">

For at vende tilbage til normal skærmvisning, klikkes på ikonet '**Gendan**'

![Underliggende data - gendan](https://3548167157-files.gitbook.io/~/files/v0/b/gitbook-x-prod.appspot.com/o/spaces%2FfDHx4SrlSNAKGCJ3m7yH%2Fuploads%2Fgit-blob-aa763d66ae227d74cbd6cc2bdd22241207c595bf%2Fhmfile_hash_fd989885.png?alt=media)

### Visning af graf eller diagram i tabelform

Ønsker man en graf eller et diagram vist i tabelform, kan der klikkes på knappen '**Vis data**':

![Knappen 'Vis data'](https://3548167157-files.gitbook.io/~/files/v0/b/gitbook-x-prod.appspot.com/o/spaces%2FfDHx4SrlSNAKGCJ3m7yH%2Fuploads%2Fgit-blob-e0d657ded4f130d2d1ab3ab365e9beb5721cb0e9%2Fhmfile_hash_9c831c50.png?alt=media)

For at returnere til normal visning af graf eller diagram, klikkes på knappen '**Vis Diagram**'

![Knappen 'Vis Diagram'](https://3548167157-files.gitbook.io/~/files/v0/b/gitbook-x-prod.appspot.com/o/spaces%2FfDHx4SrlSNAKGCJ3m7yH%2Fuploads%2Fgit-blob-f140f877b999018d536093fe3a4ffb3384bf3877%2Fhmfile_hash_4c9dba8a.png?alt=media)


---

# Agent Instructions
This documentation is published with GitBook. GitBook is the documentation platform designed so that both humans and AI agents can read, navigate, and reason over technical content effectively. Learn more at gitbook.com.

## Querying This Documentation
If you need additional information that is not directly available in this page, you can query the documentation by asking a question.

Perform an HTTP GET request on the following URL with the `ask` and `goal` query parameters:

```
GET https://manual.egclinea.com/bi/ovrige-funktioner.md?ask=<question>&goal=<user_goal>
```

`ask` is the immediate question: it should be specific, self-contained, and written in natural language.
`goal` is what the user is ultimately trying to achieve, the reason they need the answer. Sharing it helps GitBook give you a better, more relevant answer. A goal is most helpful when it describes the outcome the user wants rather than restating the question. For example, with `ask=how do I create an API token`, a goal like `automate deployments from our CI pipeline` lets GitBook tailor the answer to that use case.

The response will contain a direct answer to the question and relevant excerpts and sources from the documentation.

Use this mechanism when the answer is not explicitly present in the current page, you need clarification or additional context, or you want to retrieve related documentation sections.